10 best graphic organizers for teachers

Dan KempElementary / Primary, High School / Secondary, Middle School

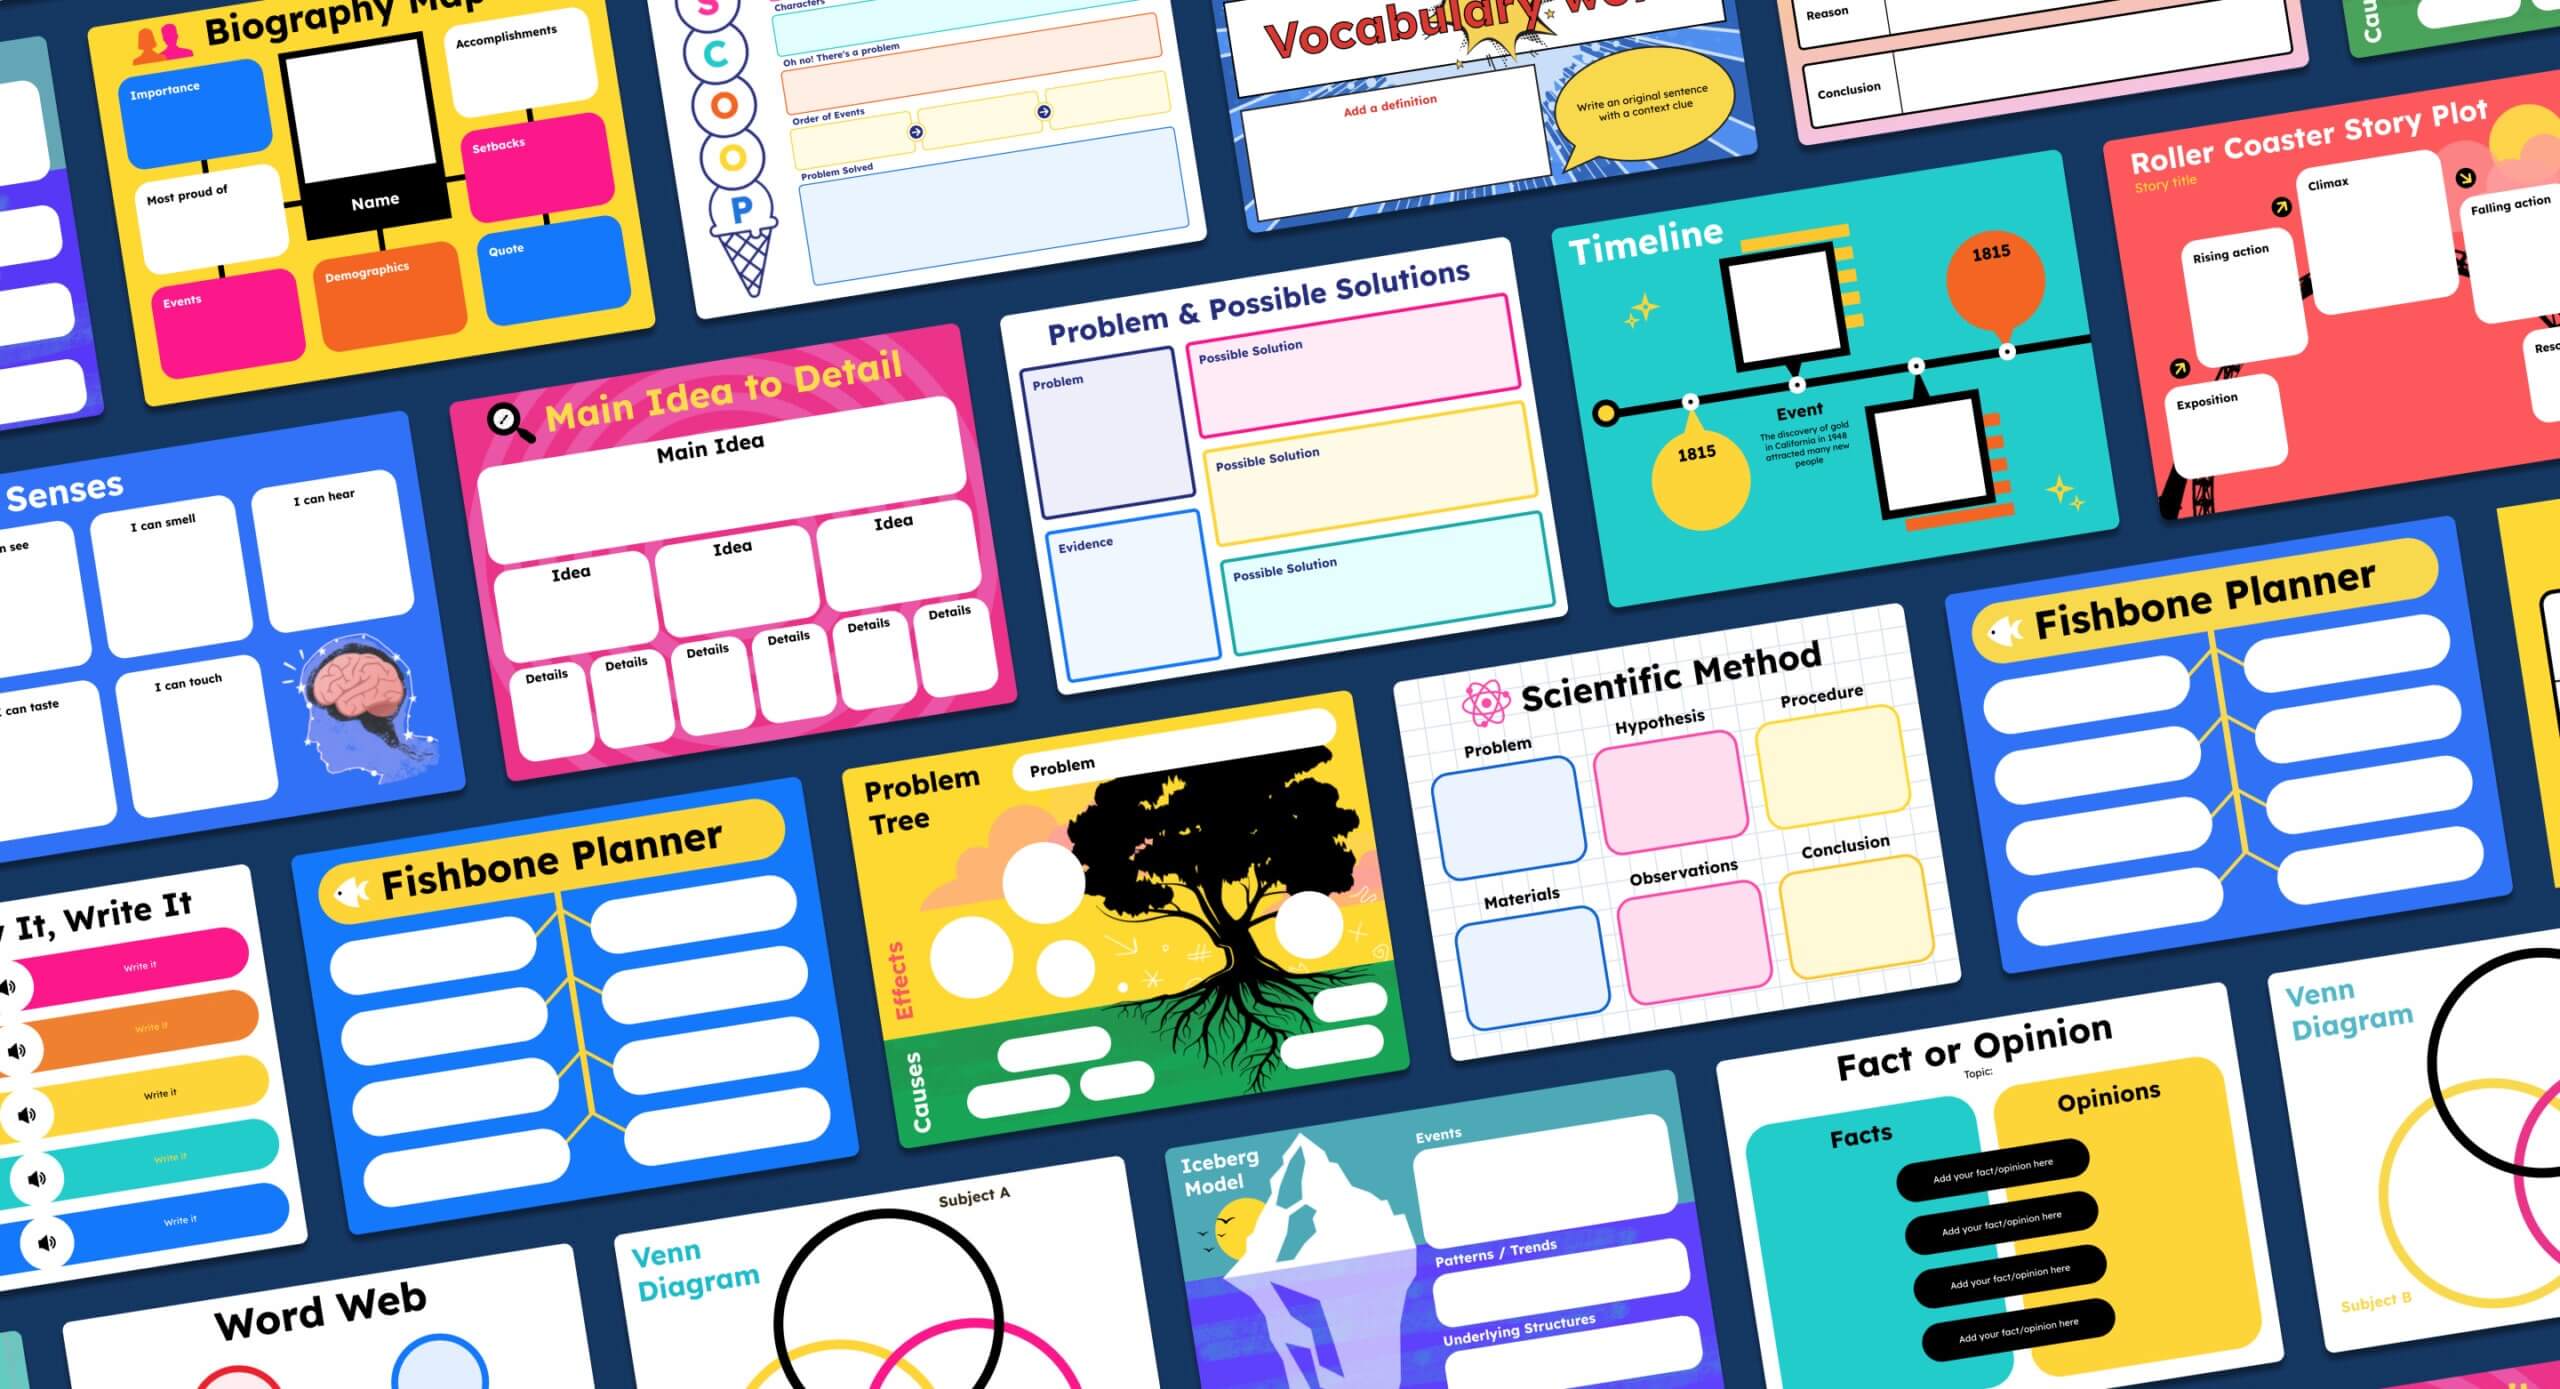
Image showing a variety of graphic organizer templates, including Biography Map, Fishbone Planner, Problem Tree, Venn Diagram, Roller Coaster Story Plot, and Scientific Method among others. These templates provide structured formats for activities like brainstorming, problem-solving, organizing ideas, and comparing concepts, supporting student learning across subjects.

Update August 2024: Graphic organizers is now part of page templates.  Read more about the page templates feature.

Graphic organizers are versatile tools that help students organize their thoughts, enhance critical thinking, and improve classroom engagement. Whether you’re teaching elementary, middle, or high school students, these tools can transform the learning experience.

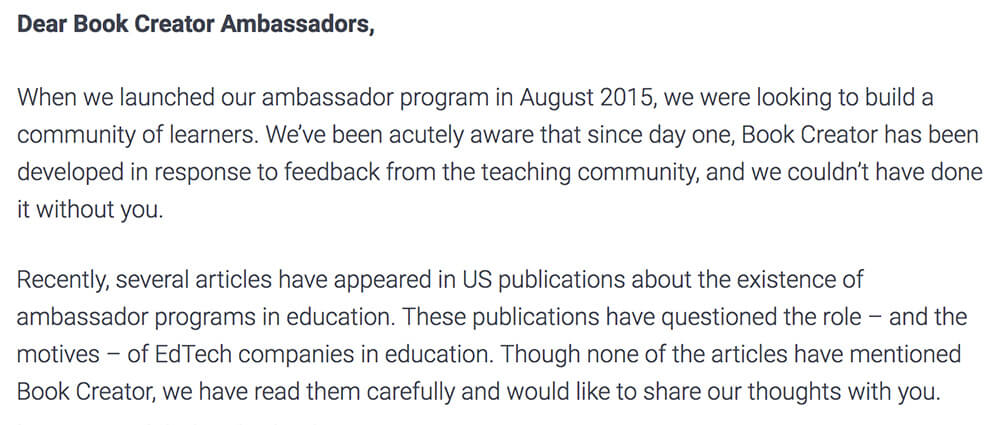
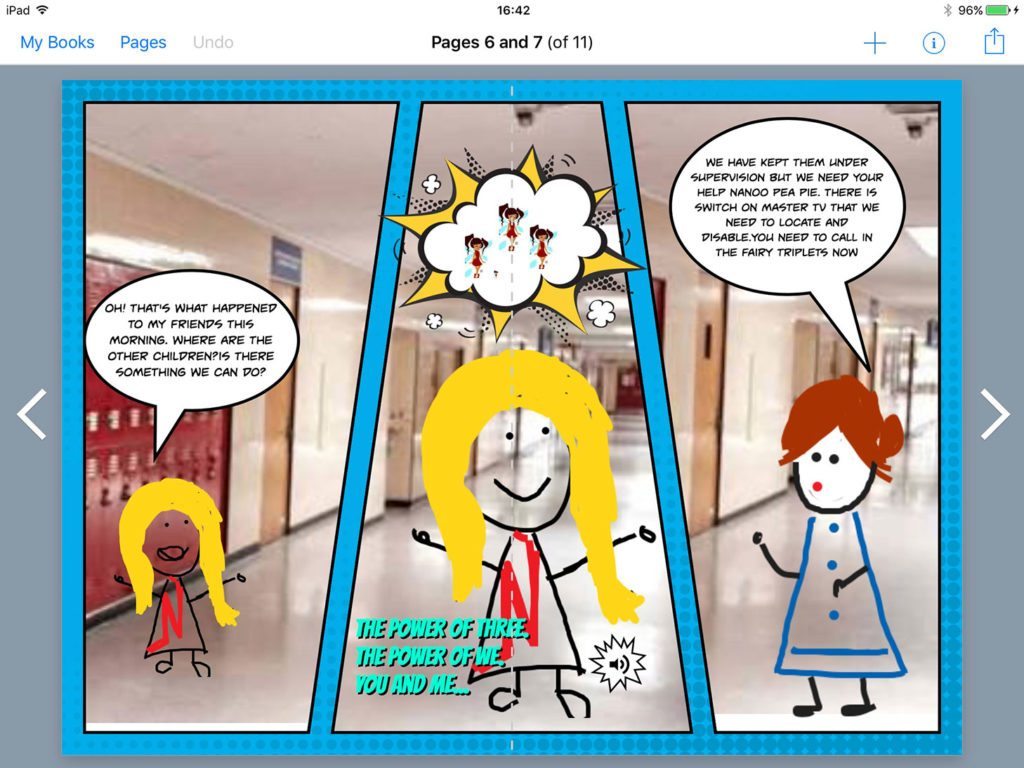
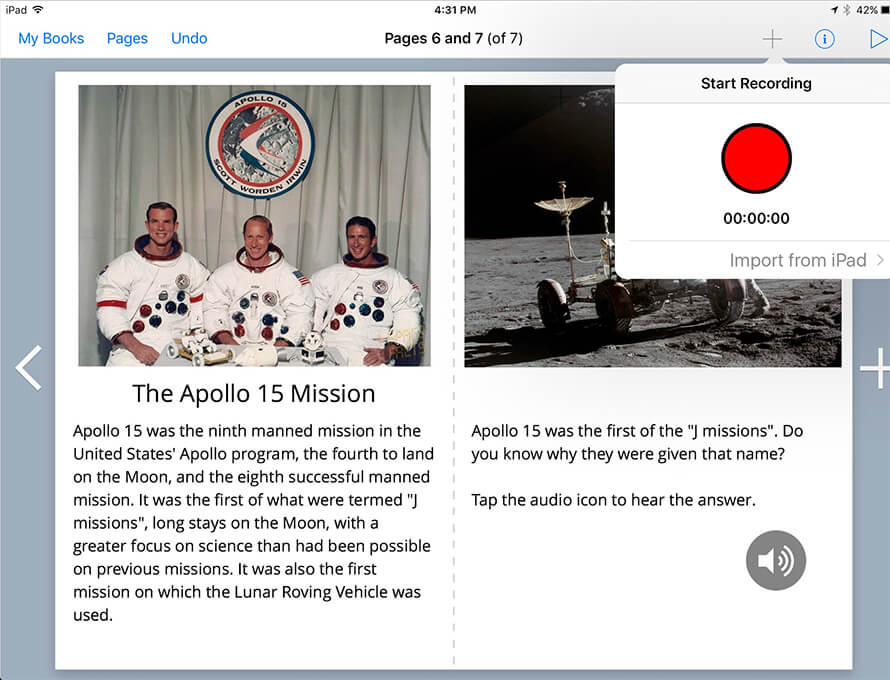
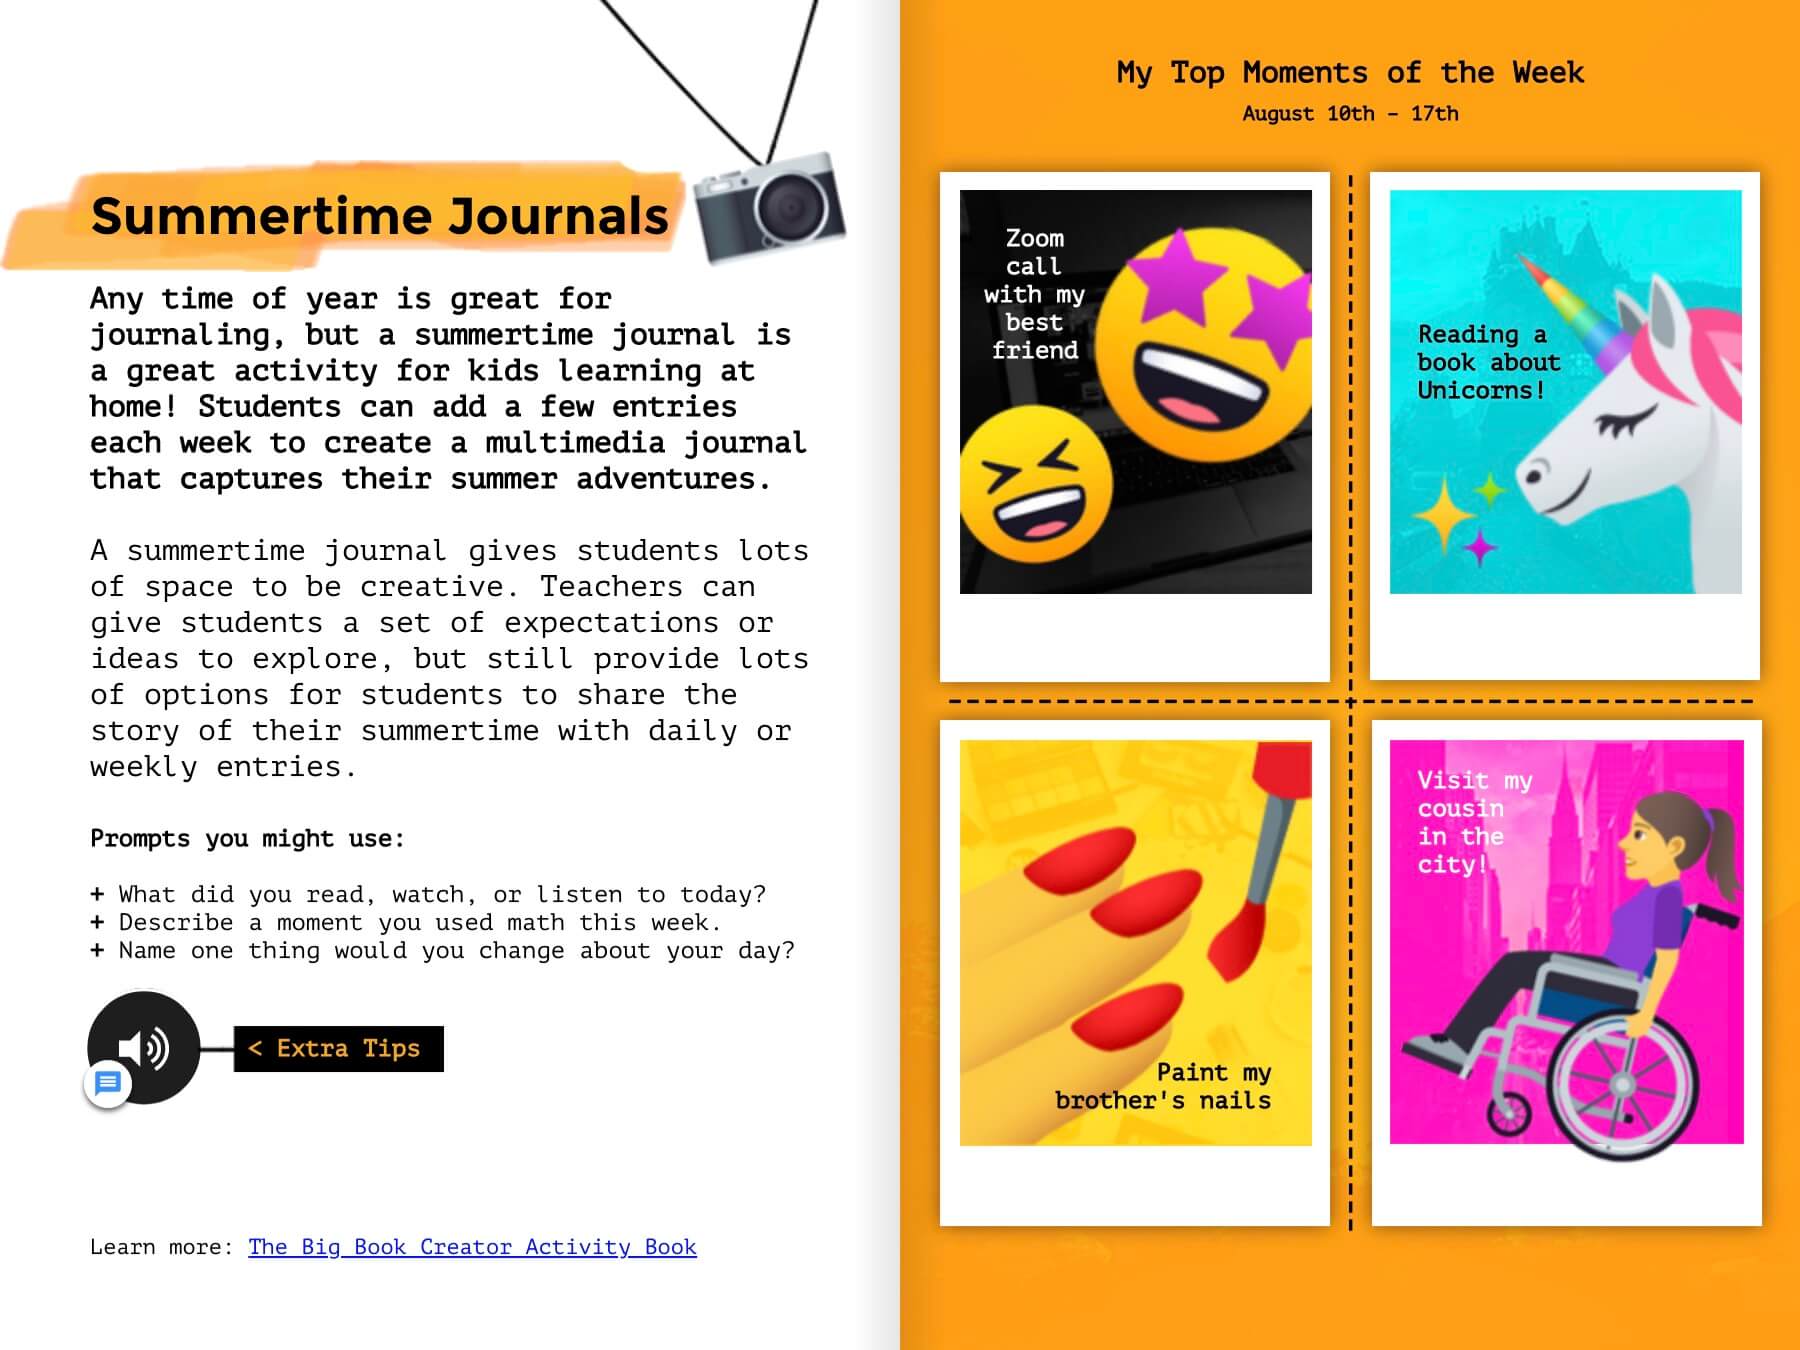
Looking for ways to enhance student learning and engagement in your classroom? Graphic organizers are powerful tools that promote critical thinking, organize ideas, and deepen understanding across all grade levels. At Book Creator, we’ve developed 800+ customizable page templates, including graphic organizers, to help you create engaging and efficient lessons.

A classic graphic organizer example, the T-Chart is perfect for comparing and contrasting two concepts or ideas. It helps students break down similarities and differences, making it an excellent tool for promoting critical thinking.

The T-Chart helps students compare and contrast two different concepts or ideas.
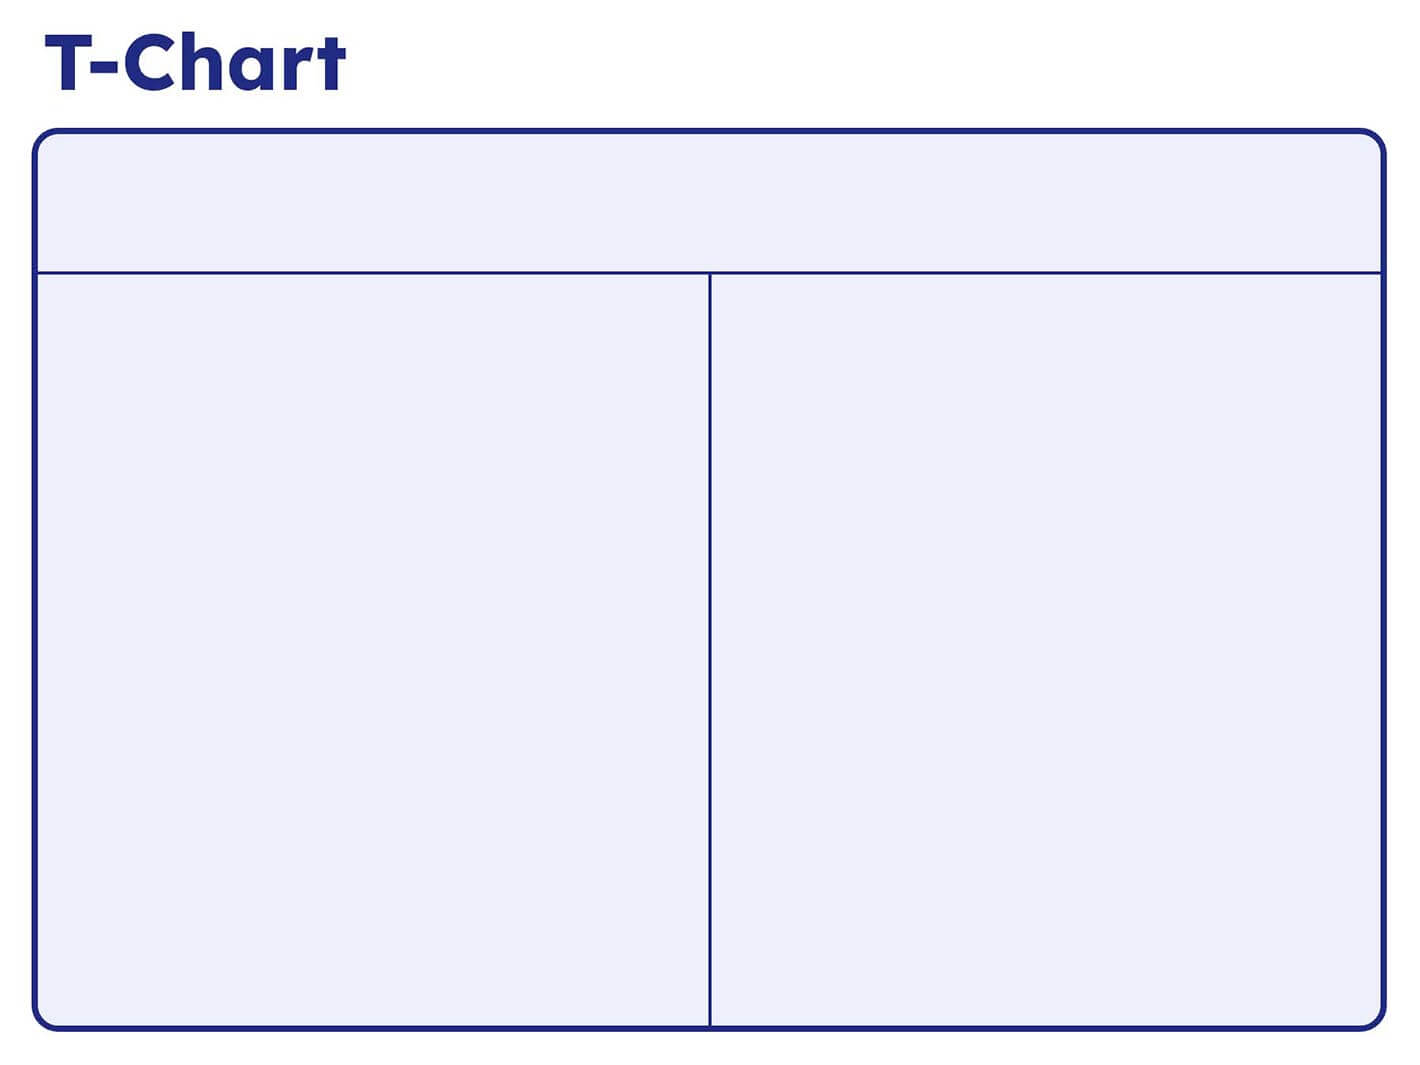
Image of a T-Chart graphic organizer with two vertical columns for comparing and contrasting ideas. The template has a simple, clean design with a blue outline, making it easy to organize thoughts visually.
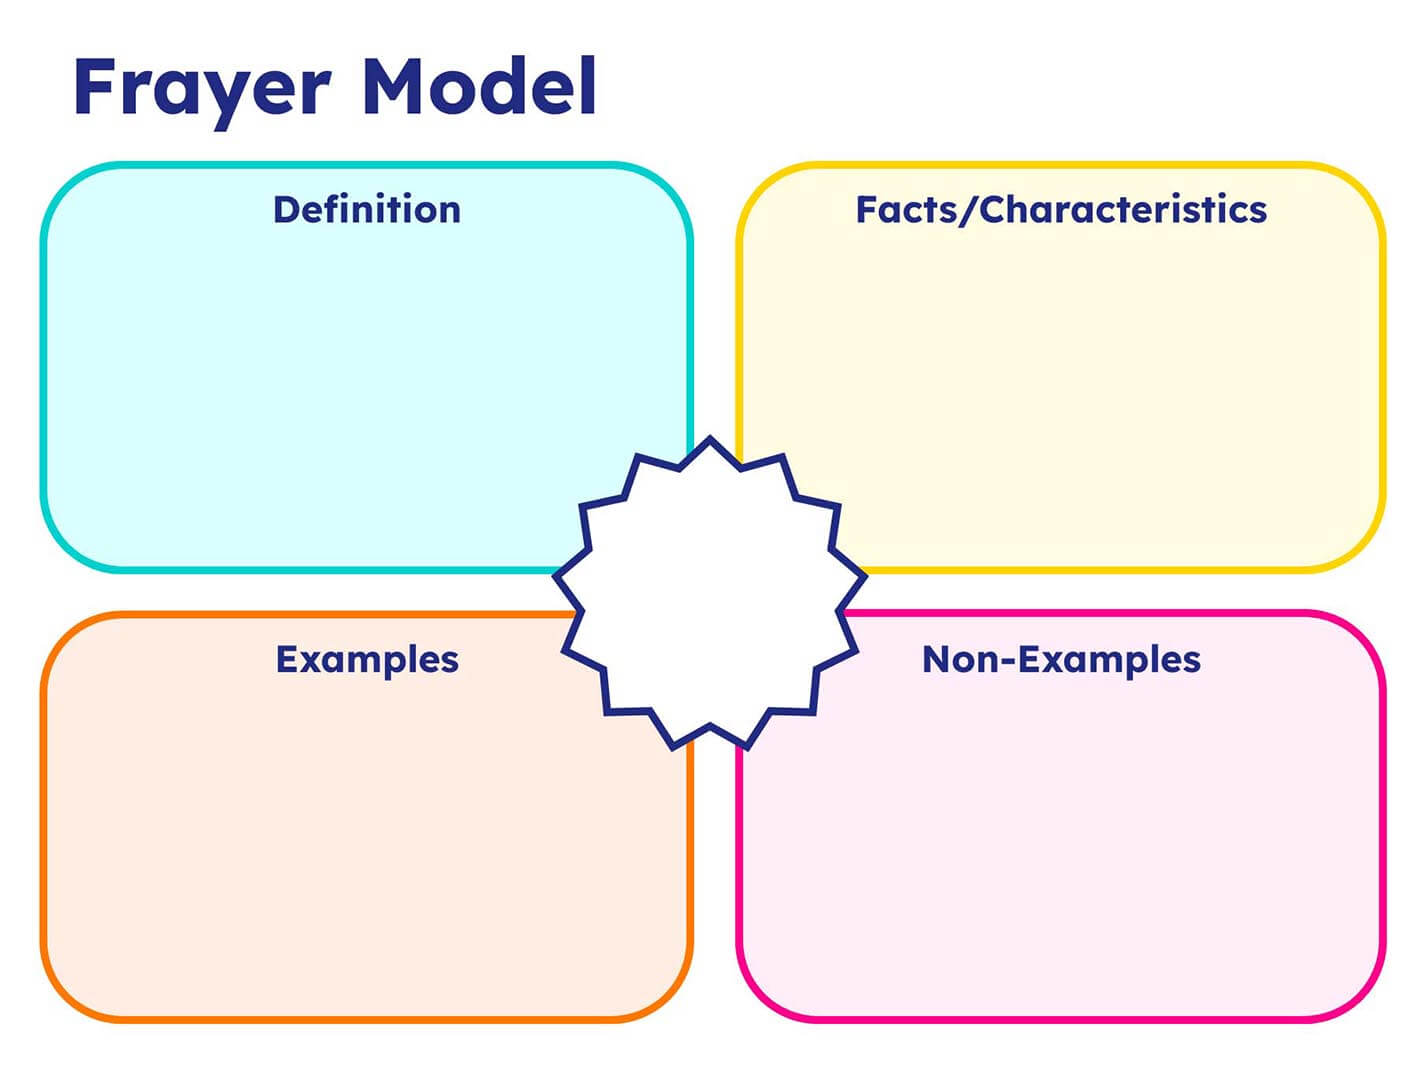
The Frayer Model is an effective way to build vocabulary. This graphic organizer guides students in defining terms, identifying examples, and noting non-examples, which strengthens vocabulary comprehension and contextual understanding.
Image of a Frayer Model graphic organizer with four labeled sections: Definition, Facts/Characteristics, Examples, and Non-Examples. Each section is color-coded, providing a clear and structured template for students to build vocabulary comprehension and explore a concept in-depth.
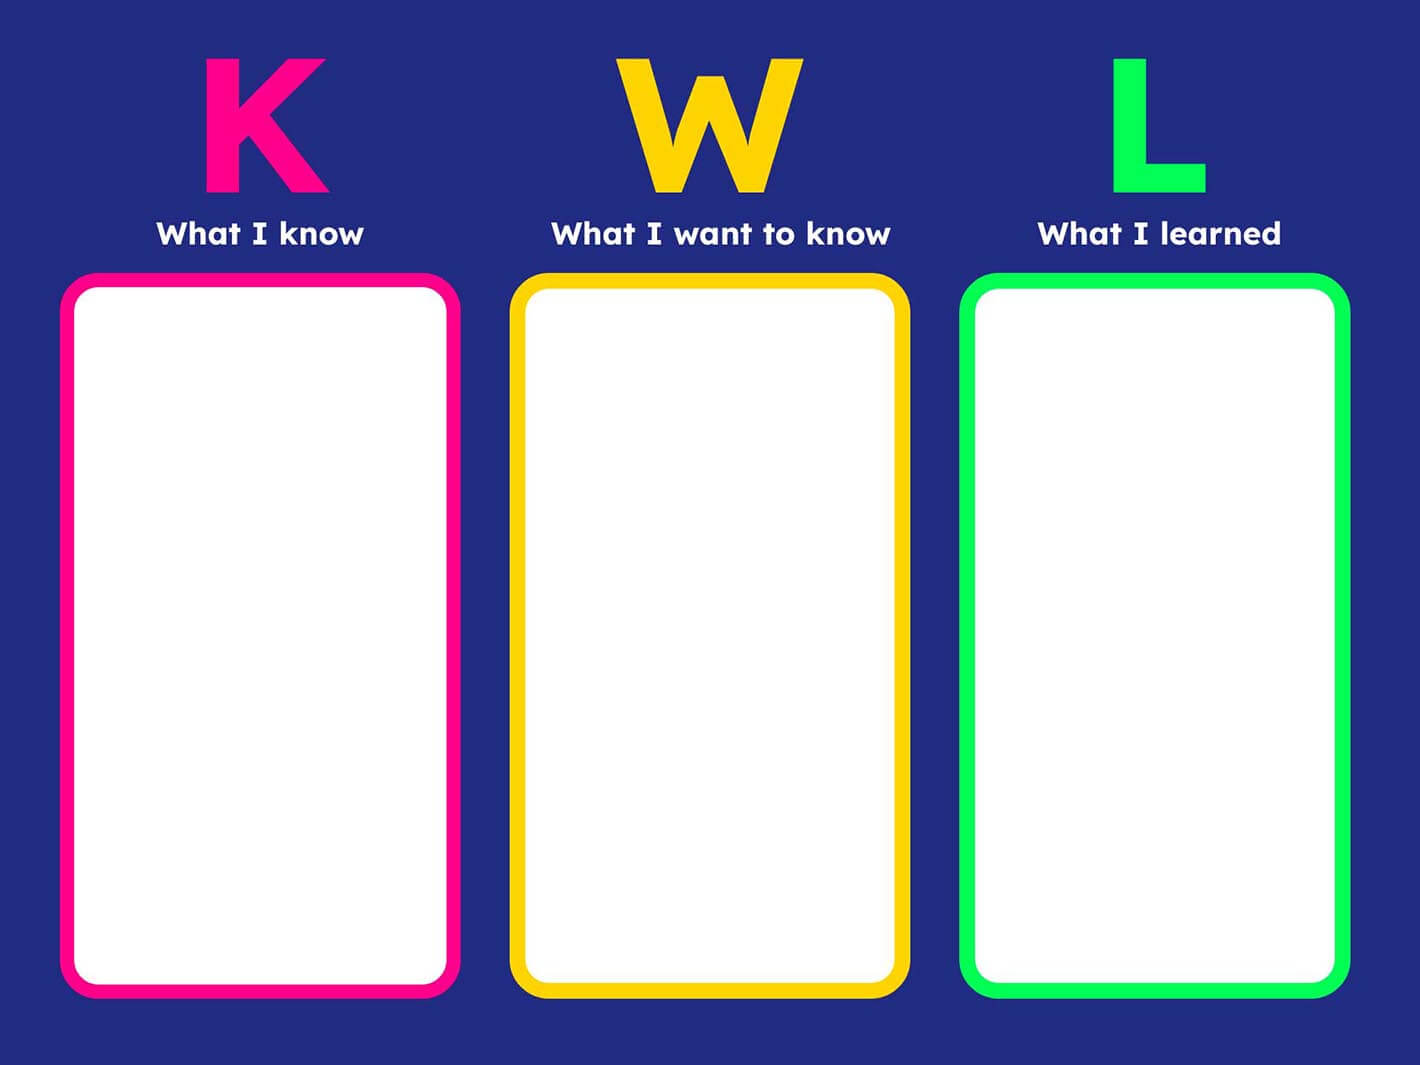
The KWL (Know, Want to know, Learned) Chart is a powerful tool for activating prior knowledge and guiding inquiry-based learning. Students begin by listing what they already know about a topic, then generate questions about what they want to learn. Finally, after exploring the subject, they document what they have learned. The KWL Chart fosters curiosity, engagement, and pushes reflection about their thinking.
Image of a KWL Chart graphic organizer with three color-coded columns: 'What I know' in pink, 'What I want to know' in yellow, and 'What I learned' in green. The bright colors and clean layout help guide students through the process of activating prior knowledge, generating questions, and reflecting on their learning.
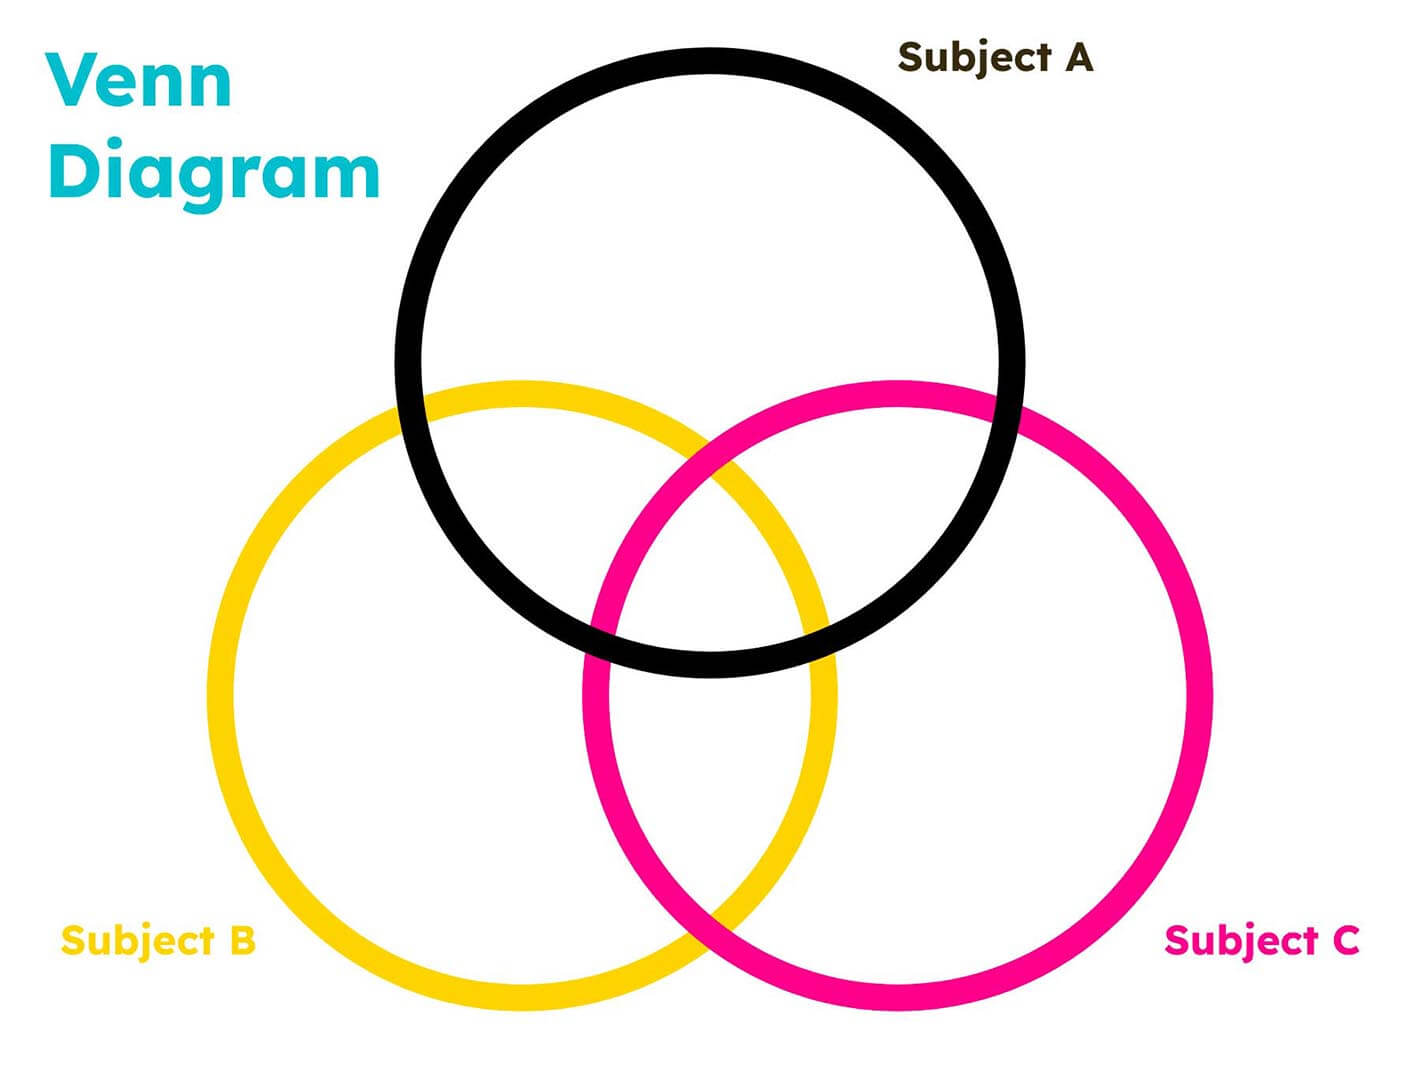
The Venn Diagram is a classic page template for visualizing similarities and differences between two or more items. It supports students in categorizing information and exploring the relationships between various concepts. The Venn Diagram encourages critical thinking and facilitates complex problem-solving.
Image of a Venn Diagram graphic organizer featuring three intersecting circles in black, yellow, and pink, labeled as Subject A, Subject B, and Subject C. This diagram helps students visually compare and contrast the similarities and differences between multiple subjects, encouraging deeper understanding of relationships between concepts.
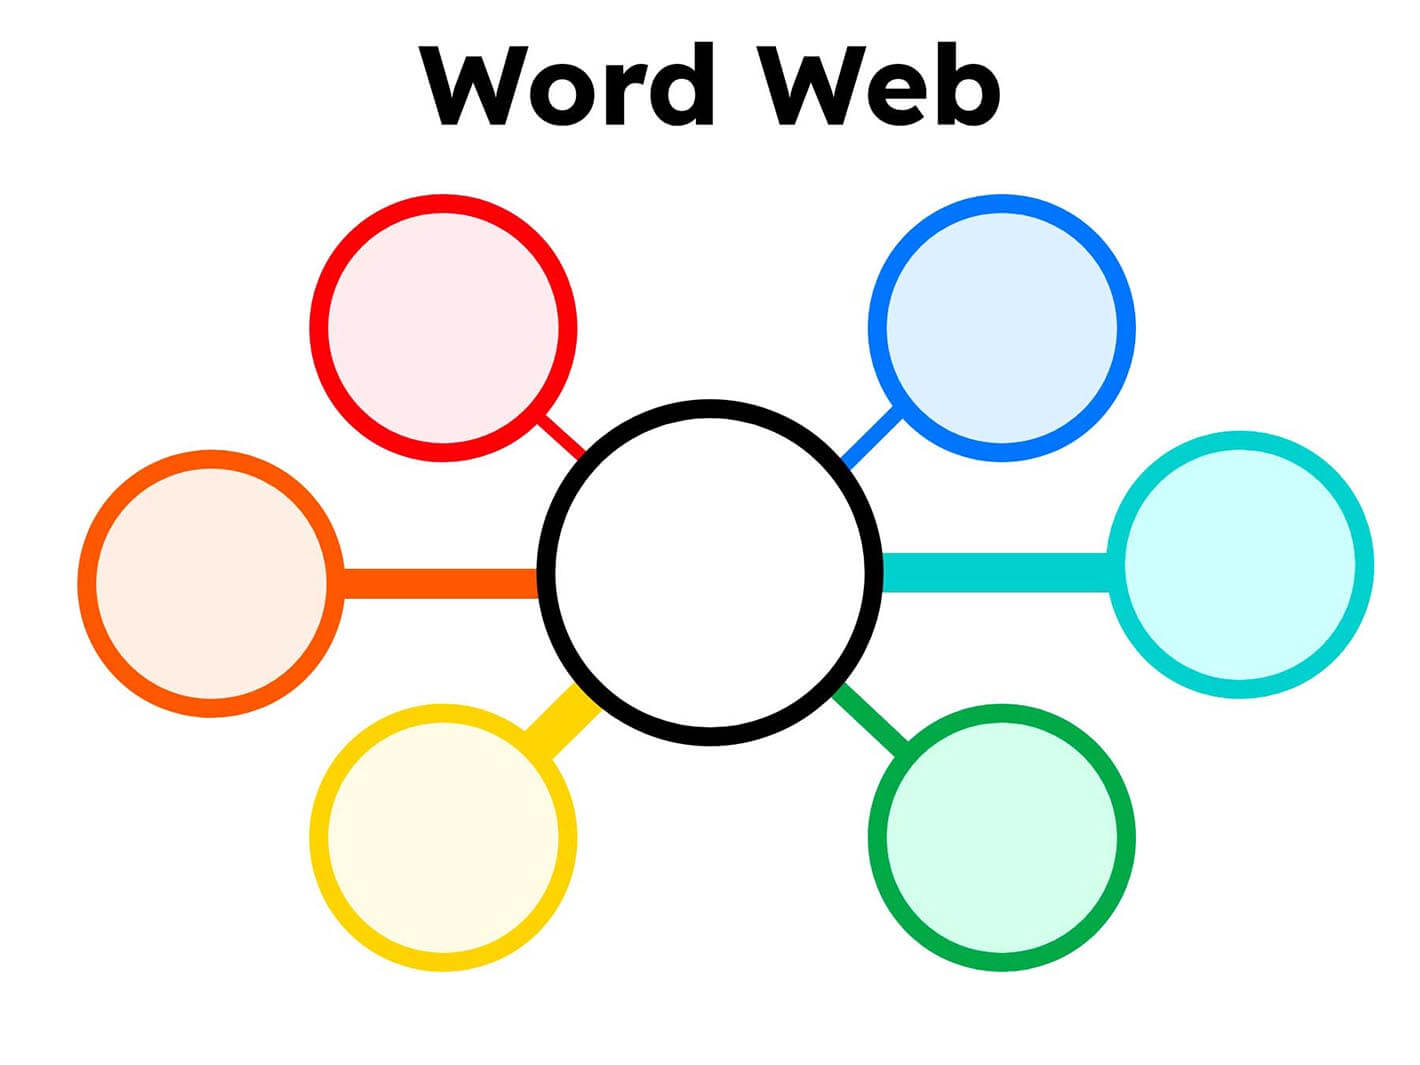
The Spider Map or word map is an effective tool for brainstorming and organizing ideas. It allows students to generate and connect related concepts around a central topic, theme or word. This visual organizer encourages creativity, expands thinking, and aids in developing coherent and well-structured writing.
Image of a Word Web graphic organizer with a central circle connected to six surrounding circles in different colors. This tool is used for brainstorming and organizing ideas, allowing students to map out related concepts or words around a central theme, fostering creativity and idea generation.
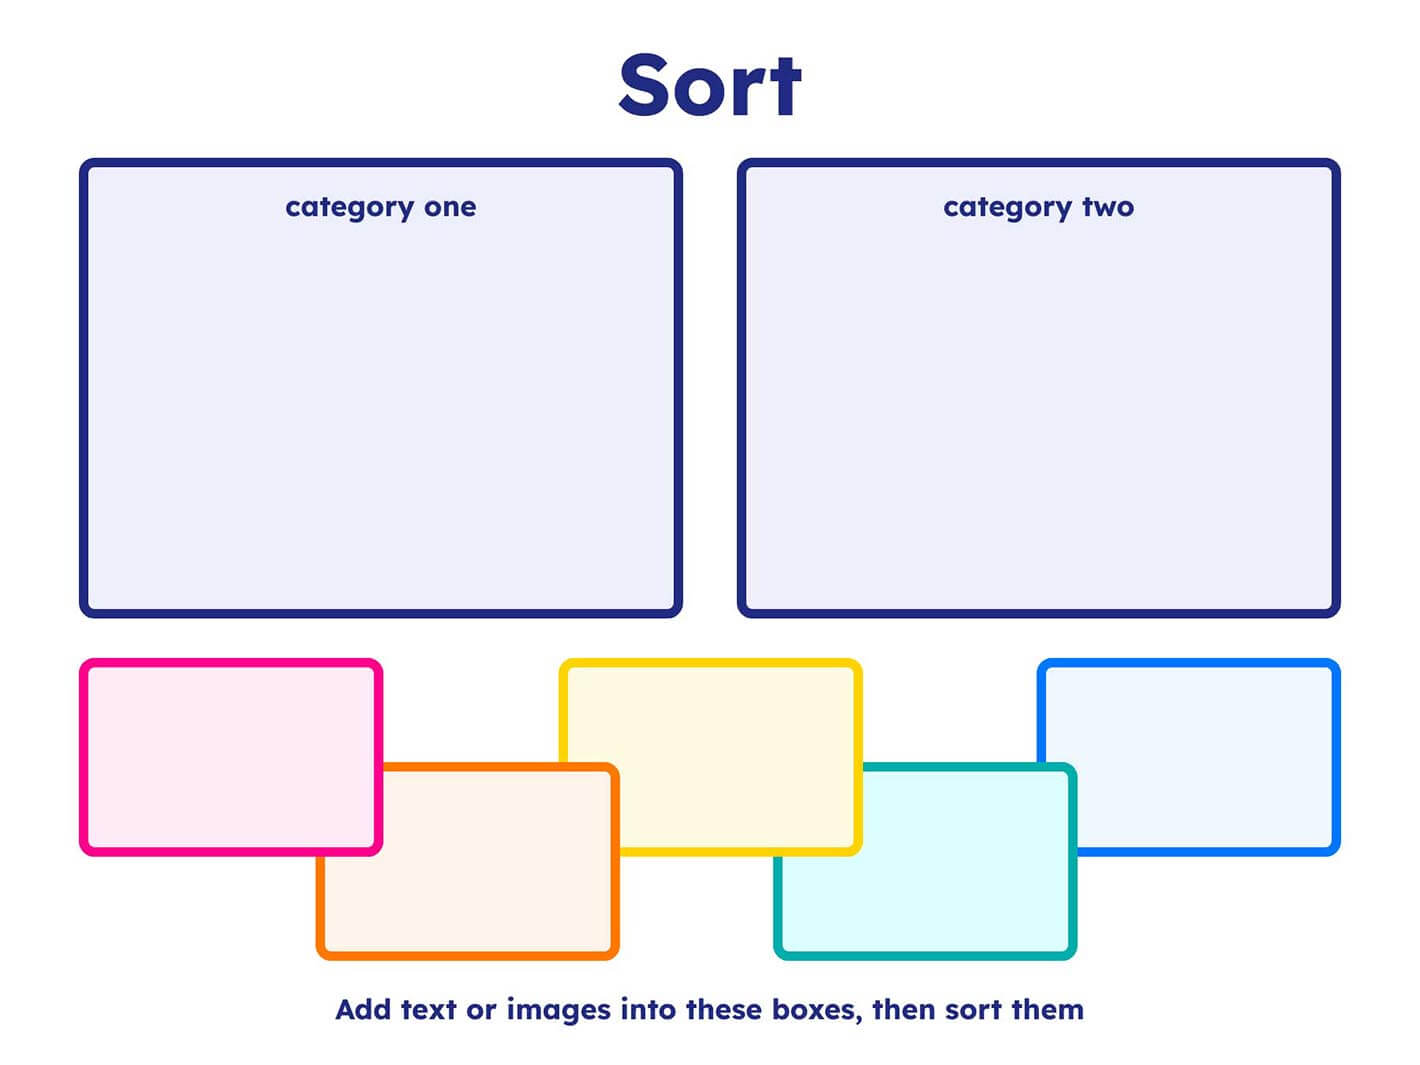
The Carroll Diagram is a type of graphic organizer used for sorting and classifying information based on specific attributes. It’s an ideal tool for logical reasoning and helps students understand relationships between characteristics.
Image of a Sort graphic organizer featuring two large labeled boxes, 'Category One' and 'Category Two,' along with smaller colorful boxes below. Students can add text or images to these smaller boxes and then sort them into the appropriate categories, promoting logical thinking and classification skills.

Similar to a Venn Diagram, the Euler Diagram helps students analyze sets and their relationships. It enables learners to visualize the logical connections between concepts, identify overlapping areas, and gain a deeper understanding of complex information.

Easily create a Euler by taking our Venn Diagram template and editing the circles position and size, so one is smaller and inside the other.
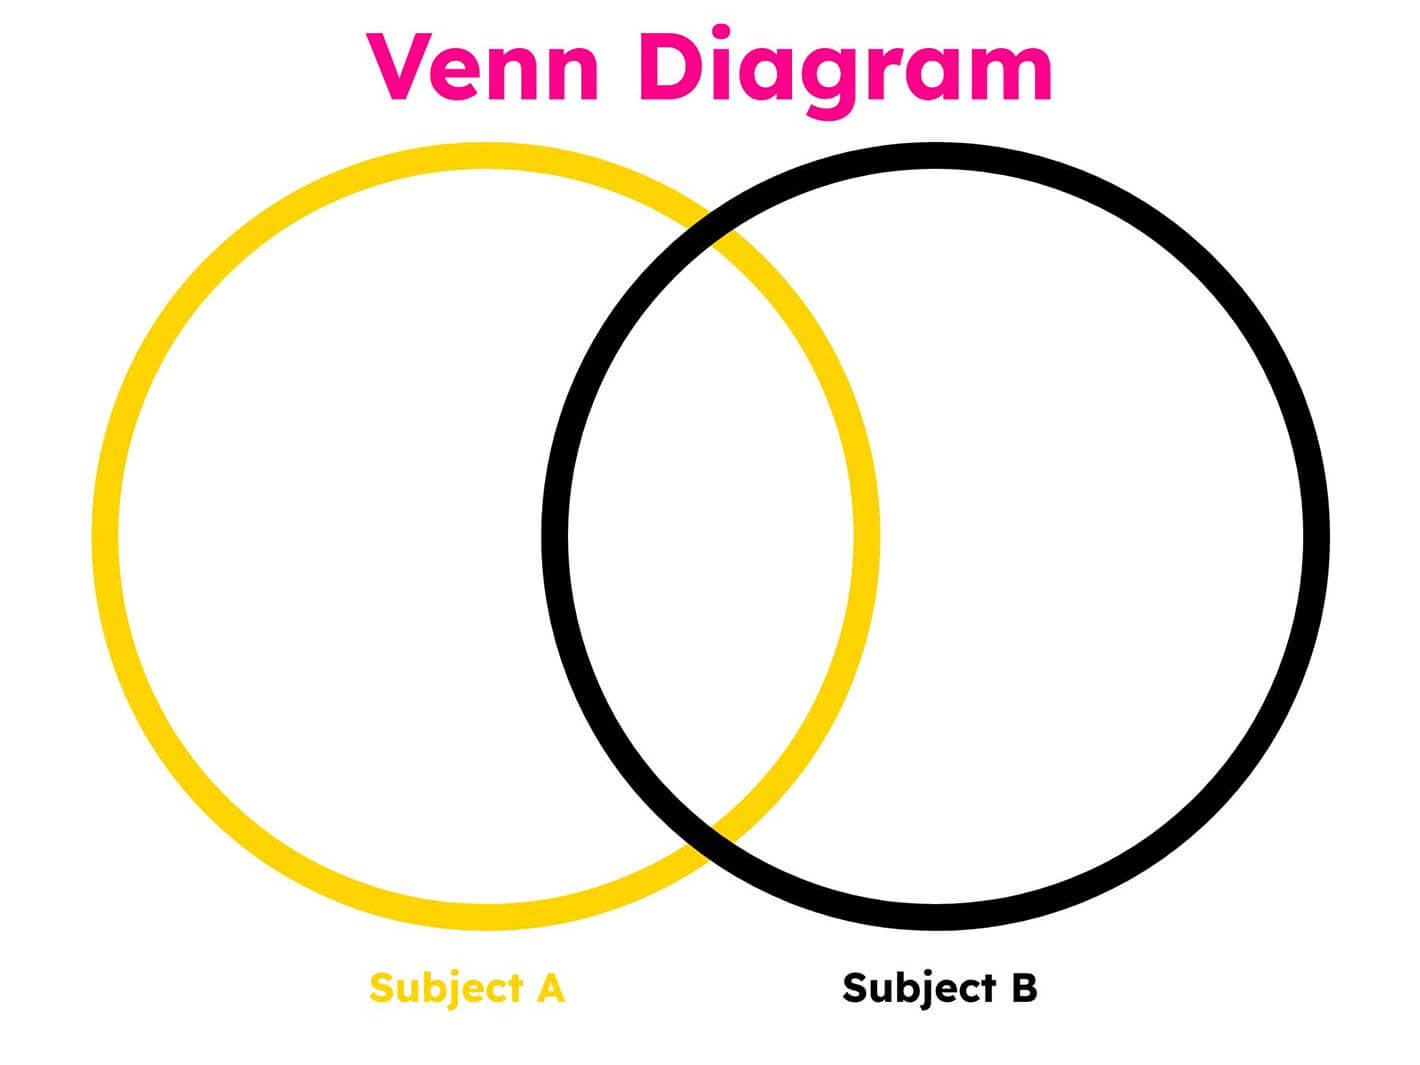
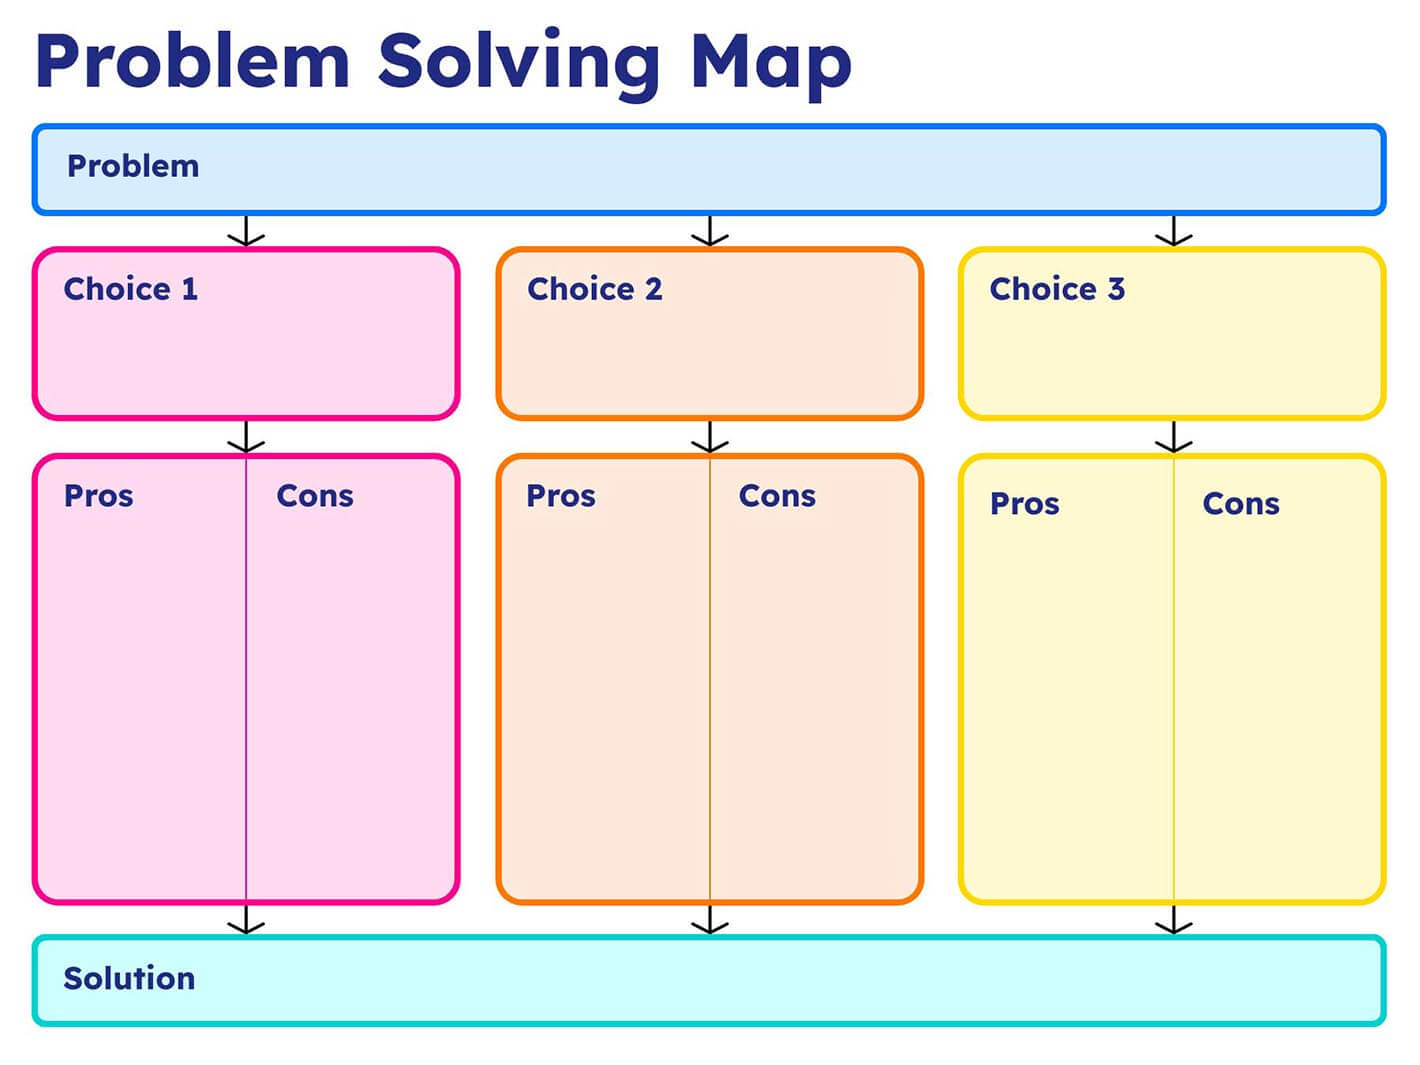
Image of a Venn Diagram graphic organizer featuring two overlapping circles, one yellow and one black, labeled as Subject A and Subject B. This diagram helps students compare and contrast two topics, identifying shared characteristics in the overlapping section and unique traits in the separate areas.
A problem-solving graphic organizer provides a structured framework for students to solve complex problems systematically. It guides them through the process of identifying the problem, brainstorming solutions, evaluating options, and reflecting on the outcomes. This organizer promotes critical thinking, decision-making skills, and resilience.
Image of a Problem Solving Map graphic organizer, which begins with a problem at the top, followed by three choices. Each choice is further broken down into pros and cons. At the bottom, there is space for the solution. This map helps students systematically analyze options and make informed decisions.
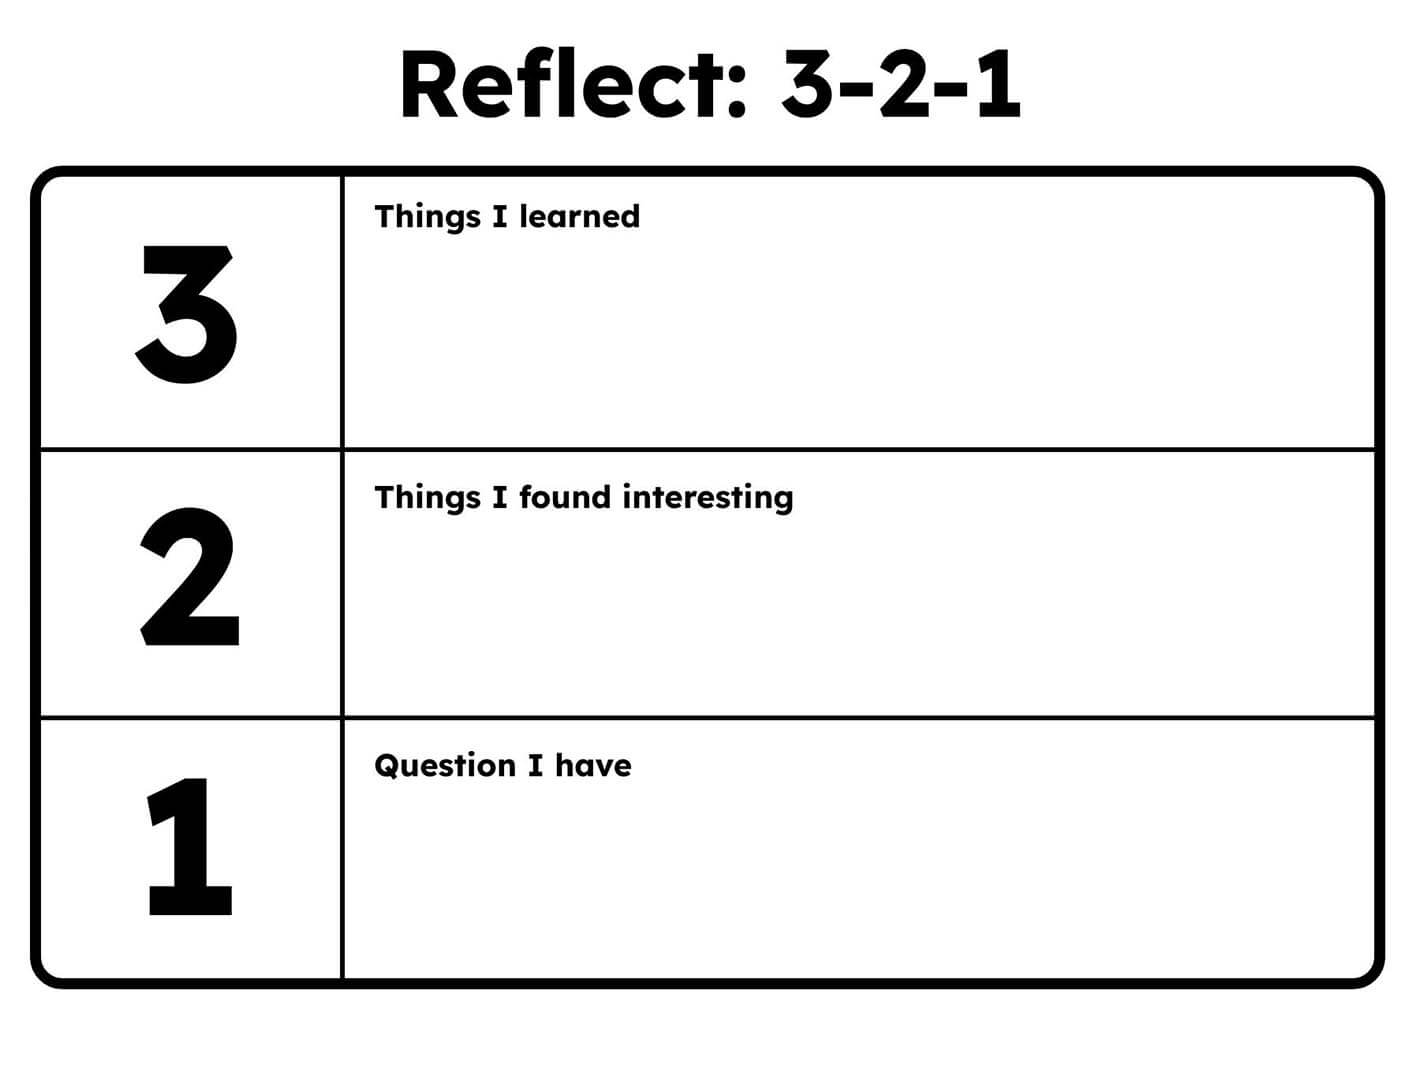
This graphic organizer example helps students reflect on what they’ve learned. The 3-2-1 Reflection Graphic Organizer asks students to note 3 things they learned, 2 things they found interesting, and 1 question they have, supporting deeper understanding and self-assessment.
Image of a Reflect 3-2-1 graphic organizer, divided into three sections. The top section asks for 3 things the student learned, the middle section for 2 things they found interesting, and the bottom section for 1 question they have. This template helps students reflect on their learning and encourages critical thinking.
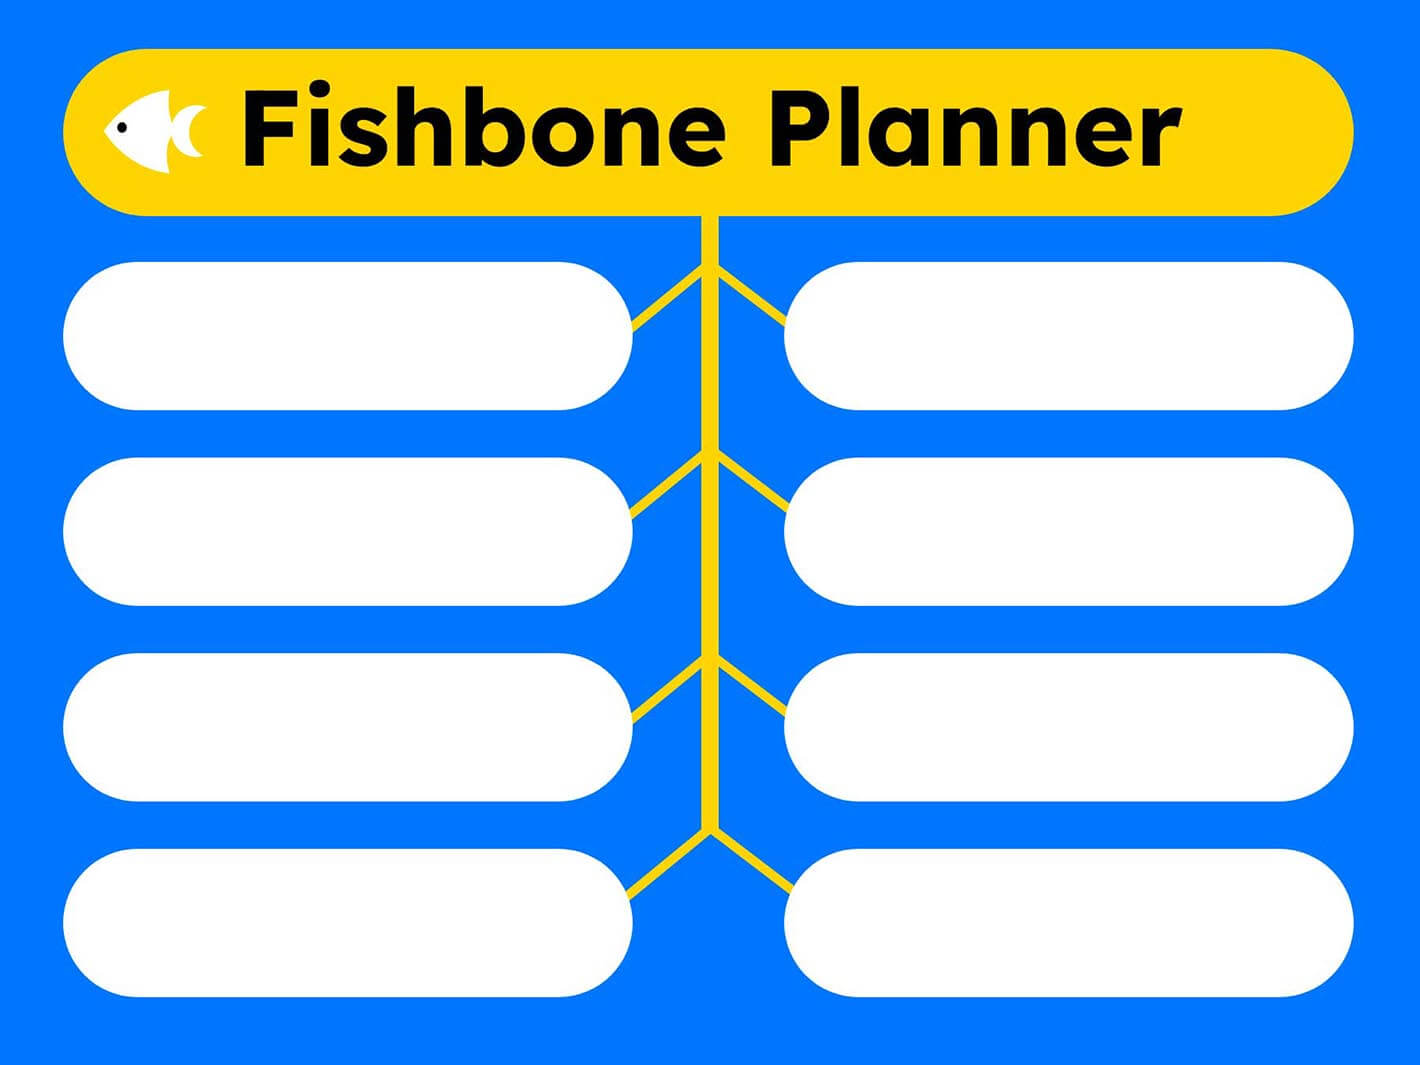
Also known as a Cause and Effect diagram, the Fishbone Planner is a powerful tool for analyzing root causes. It encourages critical thinking and helps students visualize the factors contributing to a problem.
Image of a Fishbone Planner graphic organizer with a fishbone-like structure. The main spine branches out into multiple sections where students can list causes or factors contributing to a central issue or problem. This tool helps in analyzing root causes and organizing thoughts systematically.

By using these graphic organizers in your classroom, you can create engaging and dynamic lessons that foster critical thinking, creativity, and problem-solving skills. Each of these 10 graphic organizers is fully customizable within Book Creator, allowing you to adapt them to your teaching needs.

Start using these graphic organizers today to create dynamic lessons that will enhance your students' learning experience!

Explore our 800+ customizable page templates in Book Creator to streamline your lesson planning and transform classroom engagement.


With Book Creator, these templates are perfect to help you get ahead with your activity sessions and stay as organized as possible with your classes. Plus, since they are completely editable you can customize each to your own preferences and needs – get creative!

Get the templates!

Sign up for a free Book Creator account and get a selection of page templates to use in your books.
Get started
Image

Related posts

Leave a Reply

Your email address will not be published. Required fields are marked *