Data science makes all of this possible! For middle schoolers, data science isn't just for tech companies—it's a way to explore the things they care about, like sports stats, social media trends, and environmental issues, all while learning skills that will shape their future.
Why teach data science in middle school?
Data science is no longer reserved for tech experts or high-level industries; it’s everywhere. From designing personalized playlists to tackling global challenges like climate change, data informs nearly every part of our lives. Teaching middle schoolers to use the data science cycle—asking questions, collecting data, analyzing patterns, and presenting results—equips them with tools to explore their world and make informed decisions.
Take something as simple as school lunch preferences. Imagine students conducting surveys, collecting cafeteria data, and analyzing their findings to suggest improvements. Suddenly, they’re not just learners—they’re problem-solvers.
Real-world connections
Data science is all around us, and middle schoolers can see its impact in areas they already love:
- Entertainment: Explore streaming algorithms to understand why Netflix recommends certain shows.
- Gaming: Analyze data on player trends in popular video games to predict which features will dominate next.
- Social Issues: Track environmental data to understand local impacts of climate change or explore voting trends in student councils.
- Sports: Use statistics to compare player performances or design winning fantasy teams.
These practical applications make data science relevant and engaging, opening doors to future opportunities.
The growing importance of data literacy
- High Demand Careers: Data science jobs are projected to grow by 36% between 2021 and 2031, far outpacing many other fields. Early exposure helps students imagine themselves in these roles.
- Building Informed Citizens: Data literacy empowers young people to question sources, identify bias, and use evidence to make decisions.
How the data science notebook makes learning accessible
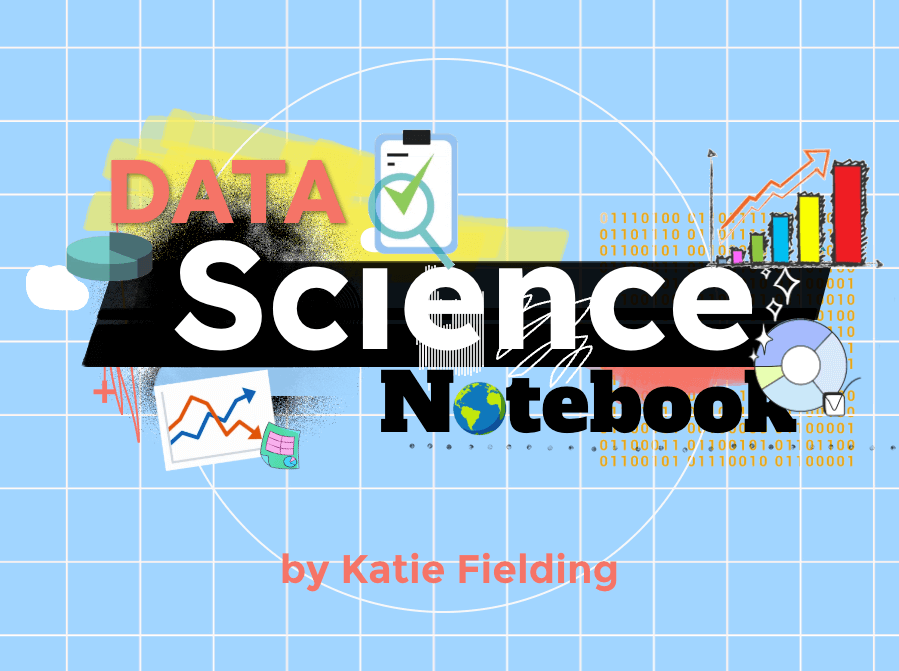
I designed the Data Science Notebook with middle schoolers in mind to make STEM education exciting and accessible. My goal was to support diverse learners by including features that promote equity, engagement, and inclusivity, ensuring every student has the opportunity to succeed.
The Data Science Notebook is designed with features that make learning accessible and manageable for all students. It scaffolds complex tasks into smaller, achievable steps—for instance, focusing on data collection one day and analysis the next—helping students stay organized and reducing overwhelm.
Multimodal accessibility tools, such as text-to-speech for students with reading challenges, speech-to-text for those who prefer verbal input, and interactive multimedia options for uploading videos, audio, or images, ensure that every learner can engage in a way that suits their needs.
What students will learn
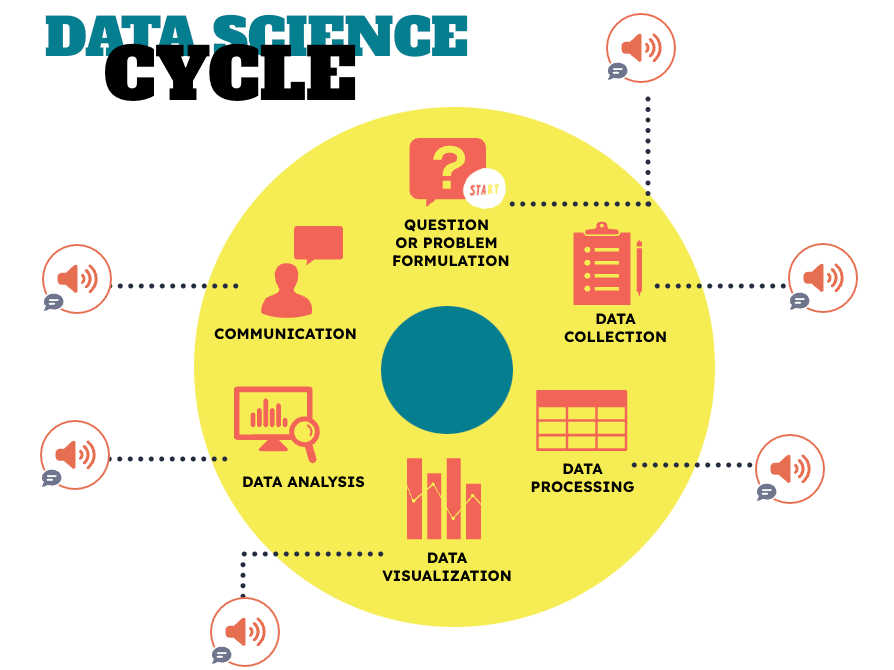
The Data Science Cycle visually explains the essential steps in a data science project, from formulating a question to communicating insights. This interactive design makes it accessible and engaging for middle school students.
The notebook introduces students to the data science cycle while connecting lessons to real-world examples that matter to them:
- Data-Driven Questions: Craft questions about topics they care about, like social media trends or favorite sports.
- Data Collection: Learn to gather data through surveys, digital tools, or observations.
- Analysis: Use tools like Google Sheets or Canva to create graphs and identify patterns.
- Bias and Ethics: Think critically about data quality and fairness.
These activities help students build practical skills like statistical analysis (mean, median, mode) while fostering critical thinking.data
How teachers can use the notebook
The Data Science Notebook is flexible and teacher-friendly. Here’s how it can fit into any classroom:
- Remix and Reorder: Customize activities to align with your curriculum.
- Assign Individually or Collaboratively: Let students work solo or in groups to explore ideas.
- Encourage Reflection: Use activities multiple times across different units to deepen understanding.
With 20 years of experience in education, Katie is passionate about creating inclusive and accessible classrooms for all students. She loves exploring new places, trying different foods, and connecting with fellow educators.


